Sydney University
Linked Eats
"How do we increase awareness of the impact food waste &
consumption has on the environment?"
Overview
"Linked Eats" is a community-oriented waste tracking app designed with the intention of reducing and increasing consumer awareness of the after-effects of food waste. The application is a different take on informing individuals of unsustainable practices in regards to waste management and average per capita consumption.
Approach
The double diamond design framework and various research methods was used as a foundation when collaborating with fellow designers and researchers in order to identify and solve a problem around food waste. It is a process that is widely used for identifying and validating problems which lead to developing a solution.
UX prototyping
Mimicking how a live, completed solution would function
User testing
Ensuring prototype functions as expected
Wireframing
generating basic structure and layout
UX research
So much character in this one.
We began conducting user research using various different methods in order to identify and validate if food waste and overconsumption are significant problems. Food is transported and goes through many stages in its lifecycle, meaning it is essential to gather data on as many of these stages as possible. As such I decided to use a combination of three research methods to base research on.
Combining these three research methods meant a balance between quantitative and qualitative attitudinal techniques to have an understanding and find correlations in various stakeholders' attitudes and actions. Interviews were conducted with workers and people exposed to food production operations and supply chain, whilst contextual observation and diary studies were aimed at consumers who typically to eat out at restaurants.
Contextual observation
We proceeded to observe food courts tracking waste over the period of an hour. These observations further reinforced the interviews by putting into perspective the sheer quantity of food waste produced within just one food court. The observations provided hard statistical evidence on how much food is wasted in retail environments from the consumers point of interaction whilst triangulating the data gathered to gain a broader view of the current problem
Questionnaires
I began to research and data gather with surveys targeting people who have or are working in restaurant/food retail environments, which are included near the end of the food production lifecycle. Interviewees were chosen from a range of good dining and fast food retail environments to generalise the broader population. Questions were based on food waste, attempting to understand how their systems worked and faltered. Whilst undertaking these interviews, I realised that my data was somewhat skewed to waste produced within food stores, without regard for the lifecycle of food and its eventual delivery to specified retailers.
I began to research and data gather with surveys targeting people who have or are working in restaurant/food retail environments, which are included near the end of the food production lifecycle. Interviewees were chosen from a range of good dining and fast food retail environments to generalise the broader population. Questions were based on food waste, attempting to understand how their systems worked and faltered. Whilst undertaking these interviews, I realised that my data was somewhat skewed to waste produced within food stores, without regard for the lifecycle of food and its eventual delivery to specified retailers.
Diary studies
Six retail worker participants underwent a diary study over four days describing the amount and type of food waste they had produced. This method compared the differences in food waste between consumption and production, supporting insights from journal articles and statistical reports. When compared to interview results, the data would show that most garbage produced, especially in food courts, was primarily leftovers from consumers. Observations also supported this despite the lack of data concerning the food creation processes in restaurants.
Six retail worker participants underwent a diary study over four days describing the amount and type of food waste they had produced. This method compared the differences in food waste between consumption and production, supporting insights from journal articles and statistical reports. When compared to interview results, the data would show that most garbage produced, especially in food courts, was primarily leftovers from consumers. Observations also supported this despite the lack of data concerning the food creation processes in restaurants.
Upon completing the discover phase, several findings regarding food waste came to fruition. The primary area of concern that had the most potential for change/impact was consumer-level food efficiencies. Food waste at the retail level is caused primarily by leftovers and offcuts/misshaped fruit & vegetables. Expiration is also a problem but comes down to human error and fluctuating demand. Short food life forces businesses into quickly turning over inventory which is at risk of changing demand for food.
Affinity diagramming
Affinity diagrams visually sort out data and organise direct quotes from participants into groups. By doing this, I identified trends that participants have in common and put them under specific themes. This method was used as an objective approach to grouping sets of information into user attitudes. I can later determine what user needs must be addressed to solve the issue. This was completed using miro.
Affinity diagrams visually sort out data and organise direct quotes from participants into groups. By doing this, I identified trends that participants have in common and put them under specific themes. This method was used as an objective approach to grouping sets of information into user attitudes. I can later determine what user needs must be addressed to solve the issue. This was completed using miro.
Affinity diagrams visually sort out data and organise direct quotes from participants into groups. By doing this, I identified trends that participants have in common and put them under specific themes. This method was used as an objective approach to grouping sets of information into user attitudes. I can later determine what user needs must be addressed to solve the issue. This was completed using miro.
Finalised user needs
"I dont think we have an efficient waste procedure"
"I dont communicate with customers effectively"
"I have to store inventory so it doesnt go off"
" Short shelf life affects the food I use to sell"
"I have to take into account fluctuating demand of customers"
"I can have too much food at one given time"
Personas
Personas are a method of creating the typical user (who is fictional) who is meant to represent the proposed target userbase of the design solution. These personas are usually a summation of a collection of data gathered from real people from interviews and diary studies. We used personas to evaluate what may bring benefits to the end-user for the most optimal experience possible.
Personas are a method of creating the typical user (who is fictional) who is meant to represent the proposed target userbase of the design solution. These personas are usually a summation of a collection of data gathered from real people from interviews and diary studies. We used personas to evaluate what may bring benefits to the end-user for the most optimal experience possible.
To begin the development stage, we first created design criteria of what is required to thoroughly and adequately reduce the impact and increase the awareness of food waste in consumers. The criteria would be based on our research previously on observations, diary studies and interviews.
To begin the development stage, we first created design criteria of what is required to thoroughly and adequately reduce the impact and increase the awareness of food waste in consumers. The criteria would be based on our research previously on observations, diary studies and interviews.
To begin the development stage, we first created design criteria of what is required to thoroughly and adequately reduce the impact and increase the awareness of food waste in consumers. The criteria would be based on our research previously on observations, diary studies and interviews.
Responds to customer fluctuations
Promotes desired behavioural change
Upon finalising the design criteria, we collectively agreed on using the brainwriting 3-6-5 to create three different and plausible solutions that could meet the given criteria. The proposed solutions viability was then evaluated through the Pugh decision matrix using the design criteria as the proponents for measurement. This involved all team members creating three ideas of their own with further iteration and features added by one another.
Upon finalising the design criteria, we collectively agreed on using the brainwriting 3-6-5 to create three different and plausible solutions that could meet the given criteria. The proposed solutions viability was then evaluated through the Pugh decision matrix using the design criteria as the proponents for measurement. This involved all team members creating three ideas of their own with further iteration and features added by one another.
Storyboards were used to better visualise and empathise what the experience would be like navigating and interacting with touchpoints throughout the user journey. Here we wanted to find each significant point of the user journey where we would be able to identify and mitigate any negative experience or interactions.
Storyboards were used to better visualise and empathise what the experience would be like navigating and interacting with touchpoints throughout the user journey. Here we wanted to find each significant point of the user journey where we would be able to identify and mitigate any negative experience or interactions.
Storyboards were used to better visualise and empathise what the experience would be like navigating and interacting with touchpoints throughout the user journey. Here we wanted to find each significant point of the user journey where we would be able to identify and mitigate any negative experience or interactions.
We performed User tests conducted to identify where users would face speed bumps in their navigation and use of the User Interface. For the analyses, we gathered participants that valued their food waste production, had general concern for climate change, and had a particular interest in eating out often.
User testing
We performed User tests conducted to identify where users would face speed bumps in their navigation and use of the User Interface. For the analyses, we gathered participants that valued their food waste production, had general concern for climate change, and had a particular interest in eating out often.
We performed user testing using low fidelity wireframes, which were hand-drawn to cut down time and effort on creating a high fidelity wireframe which would have to change due to the results of pain points found. As a result, we found multiple mishaps with the 1st wireframes ranging from not knowing what had happened after pressing buttons (lack of feedback) and unnecessary complexity (no consistency)
We performed user testing using low fidelity wireframes, which were hand-drawn to cut down time and effort on creating a high fidelity wireframe which would have to change due to the results of pain points found. As a result, we found multiple mishaps with the 1st wireframes ranging from not knowing what had happened after pressing buttons (lack of feedback) and unnecessary complexity (no consistency)
We performed user testing using low fidelity wireframes, which were hand-drawn to cut down time and effort on creating a high fidelity wireframe which would have to change due to the results of pain points found. As a result, we found multiple mishaps with the 1st wireframes ranging from not knowing what had happened after pressing buttons (lack of feedback) and unnecessary complexity (no consistency)
Low fidelity
Use effects like Transforms and Parallax scrolling.
Sketch
Use positioning to fix topbars, sidebars, and backgrounds.
Low fidelity
Use effects like Transforms and Parallax scrolling.
High fidelity
Connect your site to the most popular apps out there.
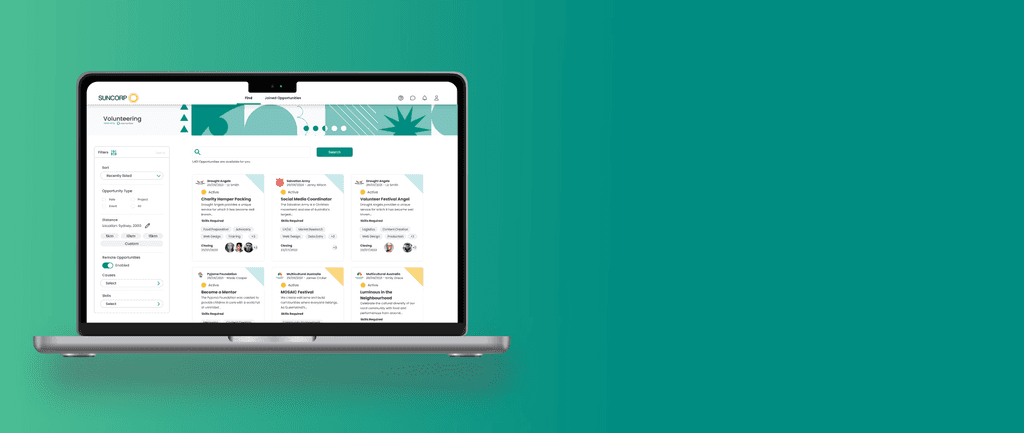
Opportunity board
Inspiring corportate volunteering at the employee level
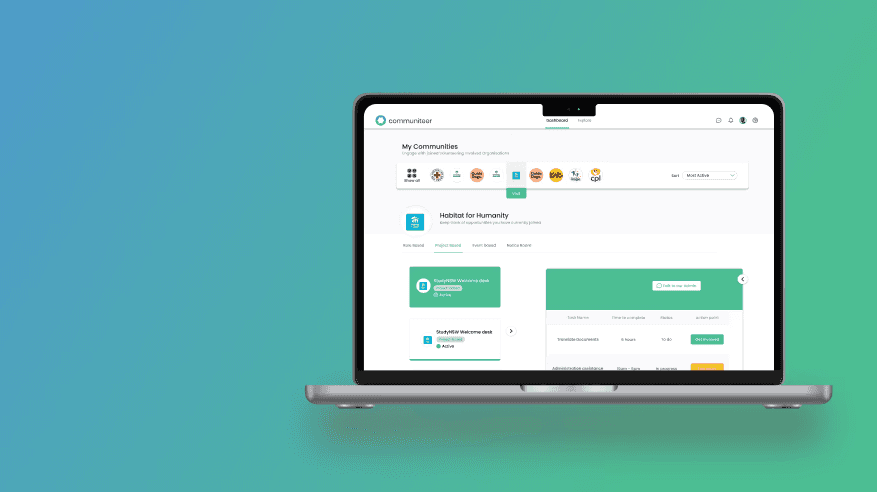
Volunteer management
Transforming volunteer manager engagement with their communities
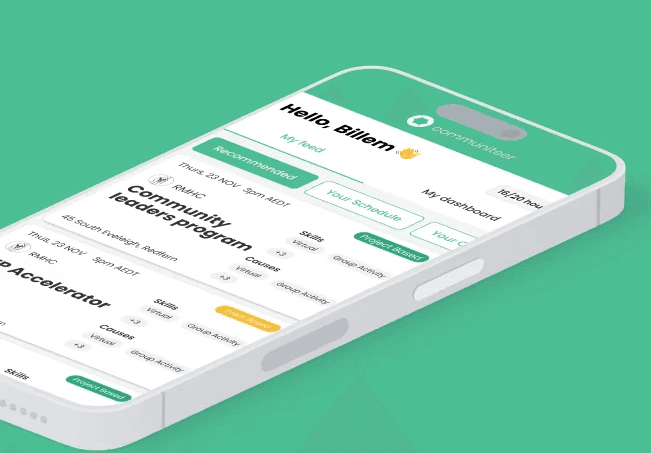
Young changemakers
Transforming how the youth of Australia traditionally volunteer


